
The Stenger Report - 10/5/26
Welcome to 4Q26, where we saw 3Q end with the S&P 500 grind out a 2.3% gain and Treasury yields jumping ~80 bps. Equity indices were mixed during another choppy trading week, with the Nasdaq up 0.5% while the S&P 500, Dow and Russell 2000 declined 0.3%, 1.3% and 0.2%, respectively. Technology leadership persisted as Nvidia (NASDAQ: NVDA) reached a record high last Friday, though weak market breadth suggests gains remain concentrated (last month S&P 500 was -0.4% while the equal-weight measure was -4.8%). September payrolls increased by only 29k (est. 90k) and unemployment rose 0.1% (to 4.2%, est. unch.) helping ease near-term expectations for another Fed rate hike. Notwithstanding the questions about labor-market momentum, markets are pricing in 82% probability of a Fed rate hold after this jobs print.
Treasury yields are comfortably higher, so is it time to panic? With the 10-year staying over 5% all last week, and the third-quarter rise in yields, history could point to equities selling off in this kind of environment. The last time yields rose this much QoQ, the S&P 500 fell by over 5% during 3Q22. This market activity followed the technical recession during 1H22 where real GDP was negative for two straight quarters. We are looking at two trends, however, that support a bullish view in the face of “everything higher” prints. First, YoY real GDP growth has been +2.7%, with positive real GDP growth QoQ, since 1H22. The last time economic growth was this strong, the S&P 500 returned ~17% annually during 1Q96-4Q00, even as the dot-com bubble started unwinding during early 2000. Second, the S&P 500 made at least one all-time high during each full quarter so far in 2026. In the last 30 years, this same setup has occurred nine times and each year the S&P has been positive in the following fourth quarter.
We see the current S&P 500 fundamental and valuation setup different than the dot-com era, though we would need more than a one-pager to make our argument. While we cannot prevent nor predict a pullback, Nick reframes the fears of a market crash on a recent episode of The Nick Stenger Show linked here: Ep. 228 – Predicting the Next Crash.
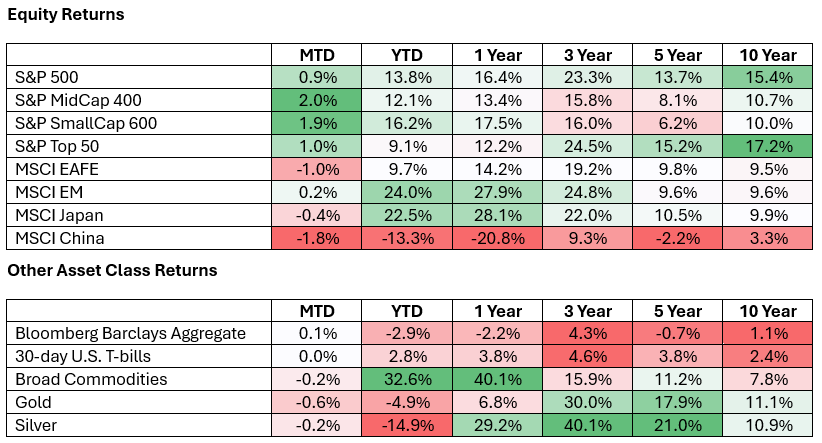
Total returns presented; Multi-year periods are annualized; Heatmap shows relative timeframe performance across all assets. Data from sources is deemed to be reliable but accuracy is not guaranteed. Past performance is no guarantee of future results. As of 10/2/26.
Nick Stenger
Chief Executive Officer
Financial Advisor
Jerry Goeden, CPA, CFA
Senior Vice President
Portfolio Manager
Financial Advisor in Chicago, IL
Stenger Family Office - Chicago Financial Advisors
150 N. Riverside Plaza
Suite 1950
Chicago, IL 60606
(630) 912-8295
Other office locations:Naperville, IL | Houston, TX | Baton Rouge, LA